
[Python] How does the Straits Times Index perform during Election?
By The Boy Who Procrastinates - July 11, 2020

The 2020 General Election results solidify as legions of election officials worked tirelessly for hours to count all 2.5 millions votes through the night.
And since it is election year, there may be a steady stream of opinions from pundits and prognosticators about how the political uncertainty of elections can weigh on stock markets.
And since it is election year, there may be a steady stream of opinions from pundits and prognosticators about how the political uncertainty of elections can weigh on stock markets.
Still, it does offer a thought-provoking idea to explore the impact general elections have on the stock market performance.
While there exists no crystal ball to predict the future of the stock market, we may instead look to the history for some interesting patterns on the interplay between politics and the market.
The Python step-by-step analysis will be shared so that we can all learn a little programming at the same time. I will be using the Jupyter Notebook which is a free open-source web application. To install any of the package used, one can simply use the command, "pip install package" on their Anaconda Prompt.
The Python step-by-step analysis will be shared so that we can all learn a little programming at the same time. I will be using the Jupyter Notebook which is a free open-source web application. To install any of the package used, one can simply use the command, "pip install package" on their Anaconda Prompt.
Performance of STI for the Election Year
For initial analysis, let's adopt a broad-brush approach and investigate how the STI performs on an election year. To begin, the first and foremost move would be to extract the STI price data from Yahoo Finance.
from pandas_datareader import data as pdr
import pandas as pd
import yfinance as yf

yf.pdr_override()

# Indicate start and end date
start = '1987-01-01'
end   = '2016-01-01'

# Generate STI price data
sti = pdr.get_data_yahoo('^STI', start, end)['Adj Close']
We define the time frame to be as far back as we can to 1987. The data of interest is the daily adjusted close price of STI.
# Extract STI year-end price data
yearly_sti = sti.groupby(pd.Grouper(freq='Y')).tail(1)

# Generate STI annual returns
yearly_rtn = round(yearly_sti.pct_change()*100,2)
Next, the price data is grouped by year and the annual returns for STI are computed by taking the percentage change between the closing price of the last day of a year and that of the preceding year.
# List the election years
election_year = [1988, 1991, 1997, 2001, 2006, 2011, 2015]

# Filter STI returns on election years
election_year_rtn = []
for year in election_year:
    election_year_rtn.append(float(yearly_rtn.values[yearly_rtn.index.year == year]))
Due to the limited availability of data, we will only be looking at the past 7 general elections. With the information on the election years inputted, we can extract the STI returns during these time periods.
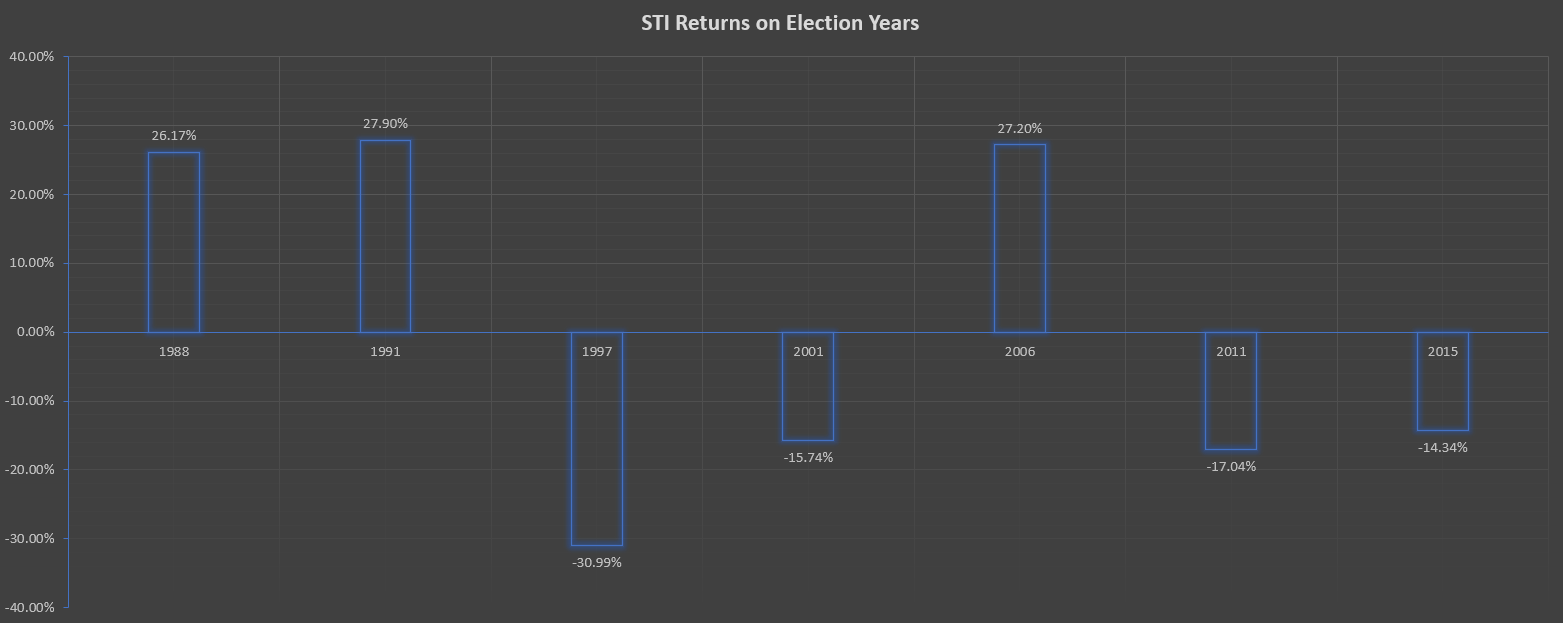
Plotting the information on a chart, we can see that the STI has posted negative returns on 4 out of 7 election years. The swing in the STI performance for these years is fairly considerable, with double digit returns being recorded for both directions.
In any case, the data presented does not seem to be statistically significant enough to illustrate the impact that general elections have on stock market performance.
Performance of STI +/- 1 month from Polling Day
For a comparatively perceptible pattern to emerge, the narrowing of time frame may perhaps be considered.Going back to our Python code, we list down the dates of the Polling Day for the past 7 General Elections.
# List the election dates
election_dates = pd.to_datetime(['1988-09-03','1991-08-31','1997-01-02',
                                 '2001-11-3','2006-5-6','2011-5-7','2015-9-11'])

# Obtain the dates one month before and after the Polling Day
election_1m_before = []
election_1m_after = []

for date in election_dates:
    election_1m_before.append(date - pd.DateOffset(months=1))
    election_1m_after.append(date + pd.DateOffset(months=1))

# Adjustment if the dates coincide with the weekends
election_1m_before_adj= []
election_1m_after_adj = []
counter1 = 0
counter2 = 0

for item1 in election_1m_before:
    if not (sti.index == item1).any():
        election_1m_before_adj.append(election_dates[counter1]
                                      - pd.DateOffset(months=1,days=1))
    else:
        election_1m_before_adj.append(item1)
    counter1+=1

for item2 in election_1m_after:
    if not (sti.index == item2).any():
        election_1m_after_adj.append(election_dates[counter2]
                                     + pd.DateOffset(months=1,days=1))
    else:
        election_1m_after_adj.append(item2)
    counter2+=1
Subsequently, we extract the price data of STI one month before and after the Polling Day. Slight adjustment may be required in the scenario when the dates coincide with the weekends.
# Compute STI returns one month before and after the Polling Day
diff = sti.loc[election_1m_after_adj].values - sti.loc[election_1m_before_adj].values
returns = diff/sti.loc[election_1m_before_adj].values * 100
Thereafter, the STI performance surrounding the Polling Day can then be computed.

After shortening the time frame to a month before and after the Polling Day, the STI has turned in losses in 5 of the 7 General Elections.
This has turned out to be somewhat a surprise to me given that the government traditionally dispenses generous handouts as part of the election budgets which in my opinion, may help to uplift the market sentiment to a certain degree.
Still, it may be premature to conclude that the stock market generally does not perform well during General Elections.
Performance of STI with the Election outcome as a factor
Could the missing piece to establishing the association between elections and stock market performance lies in the election results? Now, this does offer a stimulating direction to pursue further. Gathering the percentage of votes won by the ruling party, PAP over the years from the public domain, we are able to add the trend line as follows:

Intriguingly, the inclusion of the election results as an additional factor does present a rather harmonious trend in the chart.
With the exception of the 2015 General Election, the STI performance surrounding the Polling Day seems to have moved in tandem to the change in percentage votes won by PAP.
To determine the connection between these 2 variables, we can employ the use of Pearson correlation coefficient.
After listing down the percentage of votes won by PAP for the past 7 General Elections, we can compute the correlation coefficient between the vote count and the STI performance.
from scipy.stats import pearsonr

returns = list(returns)

# List the vote percentage won by PAP for the past elections
vote = [63.2, 61, 65, 75.3, 66.6, 60.14, 69.86]

# Calculate the correlation coefficient between the vote count and STI returns
corr, _ = pearsonr(vote, returns)
print('Pearson correlation: %.3f' % corr)
Pearson correlation: 0.701
For starters, the Pearson correlation coefficient measures the linear correlation between two variables. It can take a range of values from -1 (perfect negative correlation) to +1 (perfect positive correlation). A value of 0 indicates that there is no association between the two variables.
Therefore, for the correlation value to reach a magnitude of 0.7, the variables can be considered to be moderately correlated.
Now, what if we exclude the statistics for 2015 General Election which seems to be an outlier in our data?
# Drop the element for 2015 General Election
returns.pop()
vote.pop()

# Calculate the correlation coefficient between the vote count and STI returns
corr, _ = pearsonr(vote, returns)
print('Pearson correlation: %.3f' % corr)
Pearson correlation: 0.765
With the exclusion, the correlation value has increased to 0.765. At this magnitude, I would say that the variables are approaching a strong correlation.
It would be fair to conclude that these correlation values seem to be congruous with the trend depicted in the earlier graph.
Final Thought
Before embarking on this little experiment, I have formed the notion that an election may impact the stock market performance in some way. Frankly, the result is much more significant than I have expected to uncover.While some clear patterns between the short-term market direction and election results have emerged, one should keep in mind that correlation does not imply causation. A cause-and-effect relationship between the STI performance and the percentage of votes won by the ruling party may not be accurately deduced if we were to base it solely on an observed association.
And even though we now have the results of the 2020 General Election, it would be sheer folly to base your stock buying/selling decision based on election results. Furthermore, the outlier for the 2015 General Election may have highlighted the irrationality of the stock markets in recent times.
All in all, it should be emphasized that past historical data should not be construed as a guarantee for future results. It would be a dangerously misleading approach to assume that the market will always display consistent pattern, especially when we are witnessing an unprecedented stock market reaction to the COVID-19.
For more programming related articles, you may wish to check out the Programming tab.
If you do not wish to miss out on any articles, you may consider following the facebook page for timely update.
Disclaimer: Kindly note that this is not a sponsored post. The Boy who Procrastinates has compiled the information for his own reference, with the hope that it will benefit others as well. It should not be used or construed as an offer to sell, a solicitation of an offer to buy, a recommendation for any security or as professional financial investment advice.

0 comments